Loses of downlinks when receiving data from TTN using LoPy4 nanogateway
-
Hi, I am trying to receive downlinks from TTN but sometimes I lose downlinks, I know that the nanogateway is a single channel gateway so I have modified the node (BL072Z) code to be able to work in one channel (868.1MHz - SF7), and the nanogateway is configured with the same parameters, I have no issues with the uplinks, does anybody knows what could be the wrong?
thanks
-
@jg_spitfire We might refer to different code. tmst is the intended time for transmission. When a packet arrives, tmst must be larger than the actual value of ticks_cpu(). So t_us is the calculated as:
t_us = tmst - utime.ticks_cpu() - 15000
That will be the time for the alarm handler, which then actually sends the downlink. The net timetmst - utime.ticks_cpu()is reduced by anther 15 ms to take in account the software needs for setting up the alarm and starting the scheduled function.In the change I suggested for analysis there was the first lines:
t_us = utime.ticks_cpu()
print("tmst = ", tmst, ", t_us = ", t_us)
in that printout, indeed
tmst > t_usis the good case. So you were right asking.
-
@robert-hh Hi, why do you say that for the good case tmst < t_us?
-
@jg_spitfire The errors you demonstrated are most likely not related to the LoPy4 and Microypthon/nanogateway software.
The timing of the xxPy device is not very precise, and the LoRa requirements are strict.
This sentence is related to timing errors intrinsic to the nanogateway + xxPy device. But the magnitude of the error is much smaller. With that error, timing is (or was) off by <200 ms. It happens more rarely with the Lopy than the LoPy4. The LoPy4 with the SPIRAM is a little bit less responsive. See also this thread: https://forum.pycom.io/topic/2676/abp-mode-and-frame-counters
and this thread:
https://forum.pycom.io/topic/2924/not-solved-lora-timing-of-lopy-and-fipy/4?_=1593150795069After having that issue nailed down a little bit, the nanogateway was pretty reliable on up- an downlinks. Actually I am not using a nanogateway for TTN any more. After a few initial tests, I decided to go for a full blown RPI based gateway with the same chipset than the one PyCom announced recently. The reason is the full channel coverage.
I still have a Lopy with nanogateway running in the Loriot network, and that one is running since March, but with almost no traffic. And the only reason it stopped in the last year was for firmware updates and removing the power.
The TTN gateway has some traffic besides mine. Like 200 packets/day. Not overly busy.
-
@robert-hh I just want to know if this behavior is expected or it should not be this kind of loses in downlinks, you say:
The timing of the xxPy device is not very precise, and the LoRa requirements are strict.
so if it is an issue proper of the device there is no an official fix right?, I mean, I would be more concerned if someone told me that he is using a lopy4 nano gateway and he does not have this kind of behavior, I have read some of your posts but I did not understand if the issue was 100% resolved, did you have the same issue and could you fixed it permanently?
-
@jg_spitfire Thank you for the log data. It indicates the reason.
tmst is sent by the TTN host and is the time at which the gateway shall forward the downlink message. The clock scale for tmst is the gateways µs-clock, in this case ticks_us. The required relation is tmst < t_us. That is true for the good case, and false for the error cases. For error1, the downlink message arrives more that 9 seconds late, for error2 and error3 it is more than 4 seconds.So there are most likely large delays in the downlink between the TTN server and your gateway. Maybe a busy WiFi network, maybe problems in the internet connection, maybe issus at the TTN server.
-
@robert-hh Hi, this is what I got:
Downlink OK:

downlink error 1

dowlink error 2

downlink error 3

downlink ok 2

all this results are from the same test and I got them in that order
the lines of code you told me to change are just for debug no?, because at the end I see that t_us is in function of the same parameters
-
@Gijs Hi, no, unfortunately I lost all that files and I don't have the firmware that I used by that time
-
You say the project worked fine in 2019, do you remember the time/firmware version and are you able to downgrade it? In the meantime, lots of new features were added, which might have disturbed the critical timing window of a downlink message. I am not sure, but let me know if downgrading helps with your problem.
The idea by @robert-hh can help here as well!
Best
-
@jg_spitfire For further analysis, please change line 416 of nanogateway.py from:
t_us = tmst - utime.ticks_cpu() - 15000into
                        t_us = utime.ticks_cpu()
                        print("tmst = ", tmst, ", t_us = ", t_us)
                        t_us = tmst - t_us - 15000
and post the result for good and bad cases.
-
@robert-hh said in Loses of downlinks when receiving data from TTN using LoPy4 nanogateway:
Is that behavior somehow repeating in time periods, like every 71, 35 or 17 seconds?
I don't think so, because I send uplinks every 20 or 40 secs and try to receive successive downlinks and sometimes works but sometimes does not works, it is a random behavior, for example yesterday I could get 7 successive downlinks with uplinks every 20 or 40 seconds (I reconfigure the uplink period of time with the downlink message) but then the 8th downlink failed, I restarted the node frame counter and started a new test but then the first 4 attempts of downlinks failed, later they worked
If the error occurs, does it affect a single message or a series of messages.
it affects to a serie of messages
From boot time of the nanogateway, is there a certain period where it works well, and then starts to fail?
No, sometimes the downlinks work ok from the start of the test, sometimes works ok after several uplinks, it is a random behavior
the strange is that I made this project in 2019 and I do not remember that I had issues with downlinks, maybe it was a bad idea to update the firmware?
-
@jg_spitfire The reason are most likely delays in the communication between the gateway and TTN. The timestamp error is flagged, if the downlink package arrives less that 15 ms before the send time, which is either the rx1 or rx2 window.
What puzzles me in the log you have is the mismatch between the tmst value in the received message and the reported t_us value. Since gateway and server do not have a common time base, the tmst value created by the gateway is echoed back by TTN to the gateway in order to find the right time for transmission. So the difference between tmst and t_us should be smaller than the rx1 (or rx2) time, whatever the TTN server tells to use. If I use the numbers for the log and the calculation from the source, it looks as if the downlink message from TTN arrives ~2.4 seconds after the uplink message from the node. That's far too late.- Is that behavior somehow repeating in time periods, like every 71, 35 or 17 seconds? If yes, it could be a problem of ticks_cpu() call. Nevertheless there is still a inconsistency in the nanogateway firmware using simple difference of time tick values instead of calling ticks_diff(). But that should happen very rarely and even if, if should affect one message every 70 seconds.
- If the error occurs, does it affect a single message or a series of messages.
- From boot time of the nanogateway, is there a certain period where it works well, and then starts to fail?
The timing error of the LoPy4 with respect to missing the rx1 or rx2 window would not be visible in the logs. The gateway would send the downlink message at a time, where the node already stopped listening.
-
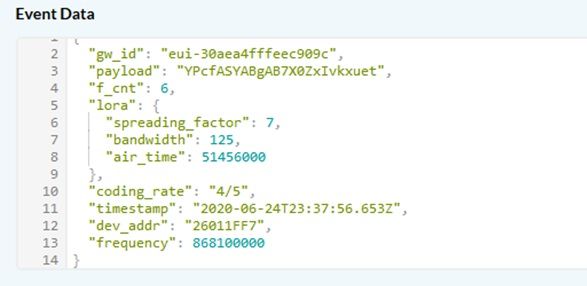
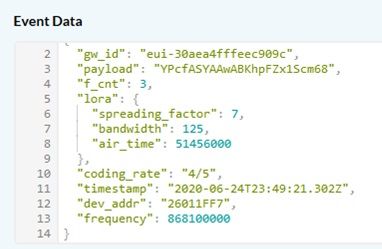
@robert-hh and @jcaron I have been doing some tests and I have got this from the TTN terminal and single channel nano gateway:
first case: downlink OK
Nano gateway: downlink received after an uplink send at 23:37:56.62773Z

TTN console: downlink sent at 23:37:56.653Z

second case: downlink timestamp error
Nano gateway: downlink error, uplink send at 23:49:20.811927Z

TTN console: downlink sent at 23:49:21.302Z

And this pattern is constant in every test, a downlink is successful when the uplink time and downlink time are almost the same but if the time between uplink and downlink is near 1 second then I got the timestamp error, is this an error caused by TTN for not deliver the downlink at right time or the issue is the gateway because the rx window is very restrictive?, I read that the rx window 1 should open 1 second after the uplink is sent but it appears that this gateway doesn't wait this time
-
Hi @robert-hh and @jcaron , sorry if I have not included enough info in my post, I forgot to mention that in TTN console I can see the downlink scheduled and then is shown as received in the next uplink, and also I forgot I had access to the gateway console, this is the message I get when a downlink fails:
Downlink timestamp error!

do you know if this could be fixed or it is a expected behavior of the Pycom modules without solution?
thanks
-
@jg_spitfire do you have any logs on the nanogateway showing down links being processed? Did you check the TTN logs?
It’s difficult to know without logs if the problem is within TTN (you may be exceeding fair use limits), between TTN and the gateway, in the gateway, between the gateway and the end device or in the end device.
-
@jg_spitfire It is hard to tell the reason w/o knowledge what is going on. You can add control messages to the nanogateway telling which frequency/SF is actually used for the download, and what was requested by the server.
It may also be that the downlink message is sent, but outside the expected window. The timing of the xxPy device is not very precise, and the LoRa requirements are strict.
If you deal with LoRa testing, you should better get some kind of receiver that allows you to detect the transmissions, like a simple USB SDR (software defined radio). Devices sufficient for that purpose are available for <20€. With these, you can at least tell, whether packets are transmitted and at which frequency. It will not help with timing errors, at least not with deviations in the ms range.