ABP mode and frame counters
-
Even if there was some discussion, it's not clear to me how the Lora stack on the devices handles frame counters for dowling messages. Is there any control on this counters, e.g. are frames rejected or dropped in case of a mismatch? Or are they simply taken as they are?
-
Wow. This is really a great debugging technique @robert-hh :)
-
@seb @daniel I made a few measurements instead of print statements. Doing that, it looks like the culprit is the Lopy as gateway, sending the join response too late. Below are two images, one of the full request/response cycle, the other is the zoom into the response time frame. The yellow trace is the sending of the request, the pink one the sending of the response, the green one the time the receive window1 is open, created by writing directly to the port register in LoRaMac.c. Sending and receiving pulses were taken "out of the air" at the respective antennas.
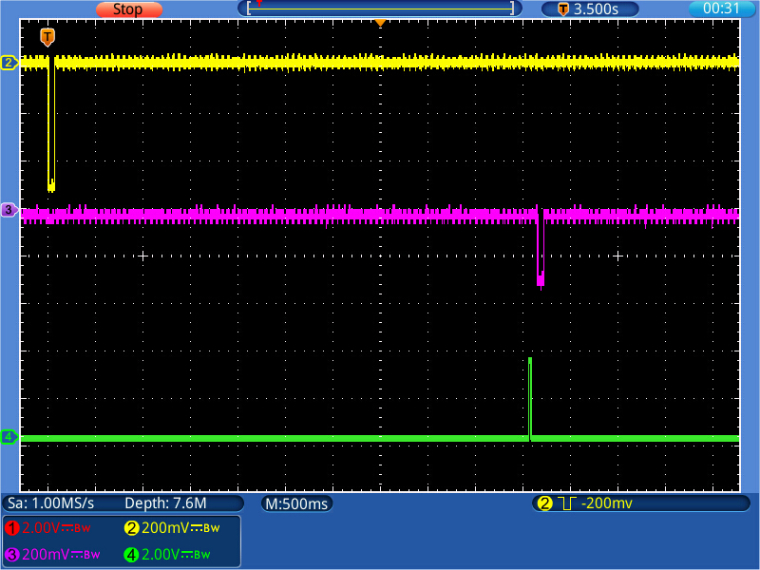
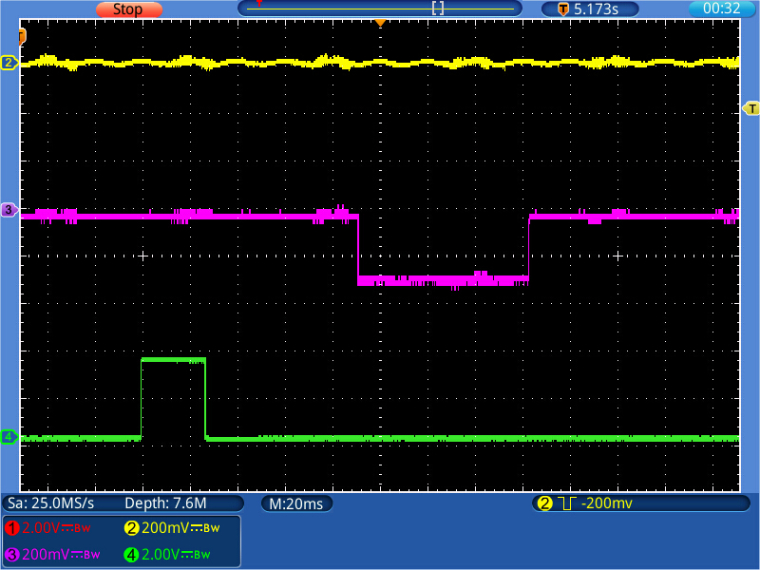
Taking the times from the measurement, with the standard 10 ms RxError;
End Send -> Begin receive window 1: 4989ms
Receive Window: 26ms
End Send -> Begin response: 5081 ms
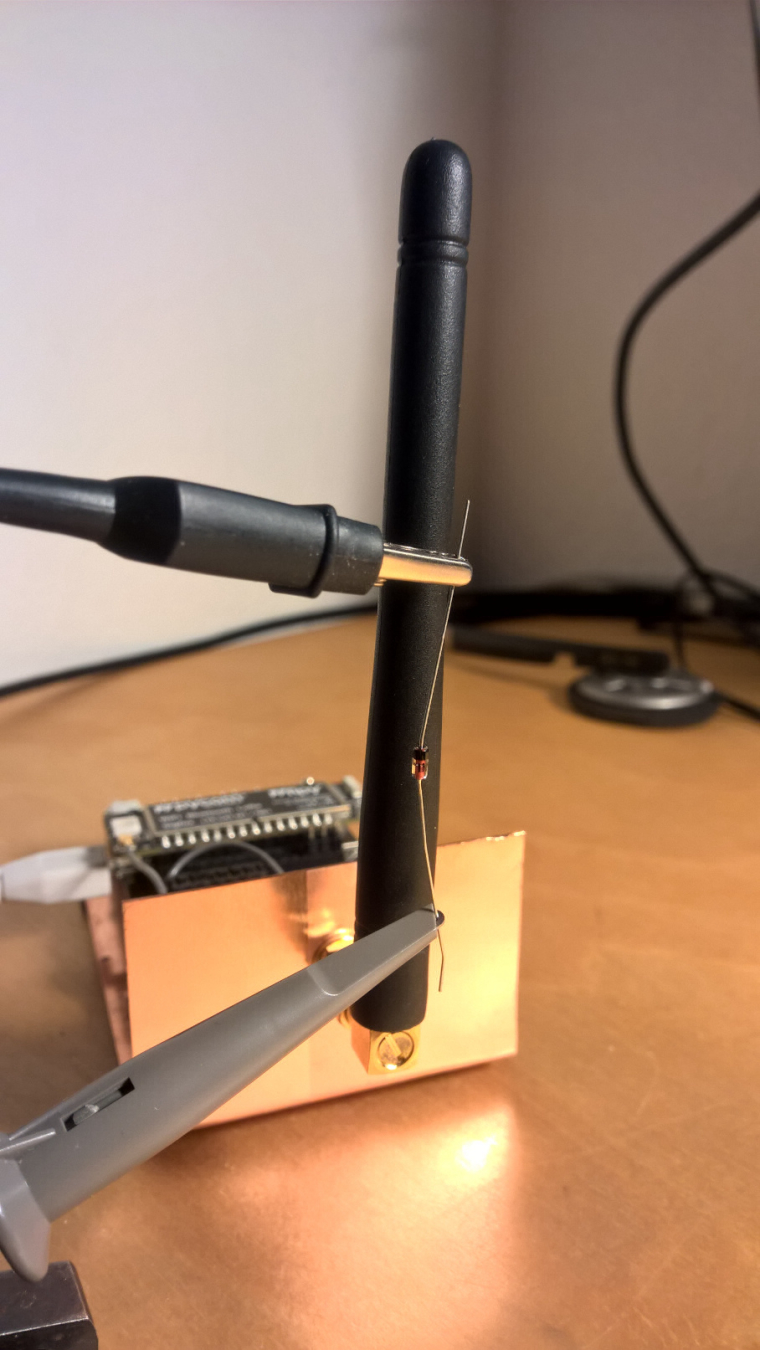
I've taken a few shots, and the all are similar.P.S.: The send events were picked up with an ordinary oscilloscope and a 1N4148 Diode at the tip, like shown below.
-
Thanks for the investigation, I have passed your issues on and @daniel is investigating further and should have a fix soon
-
@jmarcelino My doubts about timing consistency seems to be valid. This morning the (almost) same set-up does not work again. The only difference: The gateway antenna is at a different place now: outdoor instead of indoor, and the receive level is 10 db less for the link between my node and the gateway.
Edit: The antenna move obviously was not the cause.
Now I have set the parameter RxError in the Lora Stack for timing error to 100ms (was 10ms), which extends the Receive Window1 to 200ms; that seems to give proper joins & receives. Pretty brute force.
-
@jmarcelino I have some success with 1.16.0.b1 and OTAA join.
I shifted the Window1Timer and Window2Timer by 30 ms. Then join worked. See the log below. The print statement in the events are extended by a µs time stamp. Since the second Window is about 36 ms long, in rare cases that has fit the message.128238502 Packet Sent Not joined yet... 2.5 Not joined yet... 5.0 133238477 OnRxWindow1TimerEvent 133315075 Packet received, size 0, rssi=33, snr=-31, macHdr.Value=1b 133316265 Join accept, mic = 0, micRx = f07afaa5 Not joined yet... 7.5 Device has joined! (rx_timestamp=0, rssi=0, snr=0.0, sfrx=0, sftx=0, tx_trials=0) Sending: b'PKT #\x00' 140675333 Packet Sent 141661700 OnRxWindow1TimerEvent 141688546 OnRadioRxTimeout 142661984 OnRxWindow2TimerEvent 142700771 OnRadioRxTimeout Sending: b'PKT #\x01' 150634673 Packet Sent 151623548 OnRxWindow1TimerEvent 151650456 OnRadioRxTimeout 152626326 OnRxWindow2TimerEvent 152665188 OnRadioRxTimeoutThe same without the extended time:
20182233 Packet Sent
Not joined yet... 2.5
Not joined yet... 5.0
25145975 OnRxWindow1TimerEvent
25172826 OnRadioRxTimeout
26181016 OnRxWindow2TimerEvent
26378878 OnRadioRxTimeout
Not joined yet... 7.5
Not joined yet... 10.0
Not joined yet... 12.5
Not joined yet... 15.0
35093248 Packet Sent
Not joined yet... 17.5
Not joined yet... 20.0
40055638 OnRxWindow1TimerEvent
40082476 OnRadioRxTimeout
41090526 OnRxWindow2TimerEvent
41288288 OnRadioRxTimeout
Not joined yet... 22.5
Not joined yet... 25.0
The hack is in LoraMac.c, about line 2330, and looks like:
    getPhy.Attribute = PHY_JOIN_ACCEPT_DELAY1;
    phyParam = RegionGetPhyParam( LoRaMacRegion, &getPhy );
    LoRaMacParamsDefaults.JoinAcceptDelay1 = phyParam.Value + 30;

    getPhy.Attribute = PHY_JOIN_ACCEPT_DELAY2;
    phyParam = RegionGetPhyParam( LoRaMacRegion, &getPhy );
    LoRaMacParamsDefaults.JoinAcceptDelay2 = phyParam.Value + 30;
Given the quite flattery timing of ESP32 I wonder how this can be made robust.
-
@jmarcelino Downgrading the node to version 1.15.0.b1 results in successful OTAA joins. Im using still the test script from the example. After the join messages are sent regularly. Only about one of four message sent by the node are seen by the gateway.
-
@jmarcelino OTAA still not working. I added a print statement to LoRaMac.c, to almost every onxxxx() function. Starting otaa_node, I get that sequence, which repeats every 15 seconds (which is the OTAA duty cycle). The number after "not joine yet" is the expired time:
>>> import otaa_node
Packet Sent
OnMacStateCheckTimerEvent
OnMacStateCheckTimerEvent
Not joined yet... 2.5
OnMacStateCheckTimerEvent
OnMacStateCheckTimerEvent
OnMacStateCheckTimerEvent
Not joined yet... 5.0
OnRxWindow1TimerEvent
OnRadioRxTimeout
OnMacStateCheckTimerEvent
OnRxWindow2TimerEvent
OnRadioRxTimeout
OnMacStateCheckTimerEvent
Not joined yet... 7.5
Not joined yet... 10.0
Not joined yet... 12.5
Not joined yet... 15.0
The messages
OnRxWindow1TimerEvent
OnRadioRxTimeout
occure almost exactly at the moment, when the join accept is sent by the TTN server. At what place are these timers set?
Edit: Even if I force these timeouts to happen much later, no packet is received.
-
@jmarcelino Some progress: Even if OTAA does not yet work, I have some progress in using ABP.
For test, I have reset the frame counters in both the node an the TTN gateway.
a) First observation: If I reset both the node and the counters in the TTN Gateway console, the frame counter start for both directions at 0. The TTN gateway will then consider the first message received as replay. I modified the xxPy software (File LoraMac.c, line 1988) to start the uplink counter at 1. Then, there is not complaint about a replay.
b) If I ask the TTN gateway to send a downlink message, it will schedule it and seems to send it only immediately after it has received a message. That may be intentional. I may have to read the specs (Along the saying: If everything else fails, read the instructions)But then I can get downlink messages. Not every one, but about 3 of 4.
So the only open issue stays with OTAA.Edit: I changed the antenna from a simple stub model to a more "professional looking" Aurel GP 868 (mentioned by TTN): 3 dB less reception level, and also the same lower RF level when sending. I do not know if the option to mount it outdoor compensates for that.
Edit 2: The difference can be cause by the 2.5 m cable, which according to the data sheet causes between 1.6 and 3 dB attenuation. But when mounting outdoor, there has always to be a cable. So: no choice besides maybe a better or shorter cable. But first of all, it has to work reliably.
-
@jmarcelino Just made a new attempt with OTAA. I captured three message pairs
:
Log at the nano-gateway:[ 73398.437] Received packet: {"rxpk": [{"data": "AAyjANB+1bNwIs0Hm0nVs3AvqeKkEQo=", "time": "2018-02-21T17:06:35.972442Z", "chan": 0, "tmst": 307781634, "stat": 1, "modu": "LORA", "lsnr": 7.0, "rssi": -24, "rfch": 0, "codr": "4/5", "freq": 868.1, "datr": "SF7BW125", "size": 23}]} [ 73398.475] Push ack [ 73402.481] Pull rsp [ 73403.434] Sent downlink packet scheduled on 312.781, at 868,100,000 Hz using SF7BW125: b' )C\x90\xd7\x0e`|u:\x03\xb8\x1bZ\xdb\xd6~\t`gf\xd4!\xc6C\xd7\x12(t>\xf2\xd3\xdd' [ 73409.099] Pull ack [ 73413.434] Received packet: {"rxpk": [{"data": "AAyjANB+1bNwIs0Hm0nVs3B9ABNCwDQ=", "time": "2018-02-21T17:06:50.970398Z", "chan": 0, "tmst": 322755727, "stat": 1, "modu": "LORA", "lsnr": 7.0, "rssi": -24, "rfch": 0, "codr": "4/5", "freq": 868.1, "datr": "SF7BW125", "size": 23}]} [ 73413.476] Push ack [ 73417.506] Pull rsp [ 73418.436] Sent downlink packet scheduled on 327.755, at 868,100,000 Hz using SF7BW125: b' Hc%*\xb9\x7f\xd1\xdb\x06\xb5\x84\xb8\xea\x00\xd3\x0b/\x83\x80\xe4\tyj+o\xf6\x87!\xdc\xa6\x93\xe1' [ 73428.425] Received packet: {"rxpk": [{"data": "AAyjANB+1bNwIs0Hm0nVs3ByjS8RHI0=", "time": "2018-02-21T17:07:05.969433Z", "chan": 0, "tmst": 337729436, "stat": 1, "modu": "LORA", "lsnr": 7.0, "rssi": -26, "rfch": 0, "codr": "4/5", "freq": 868.1, "datr": "SF7BW125", "size": 23}]} [ 73428.473] Push ack [ 73432.483] Pull rsp [ 73433.427] Sent downlink packet scheduled on 342.729, at 868,100,000 Hz using SF7BW125: b' \xe6\x0c-\x9d<\xa5G%\x8e<L\xdb\xe7\xfb\x90\x97\xb7\xfb[l(\xd4\x15\xfeN\\\xb4\x8c\x054\x8e.'Gateway log at TTN:
18:07:10868.14/5SF7BW12571.9
18:07:06868.14/5SF7BW12561.7app eui:70B3D57ED000A30Cdev eui:70B3D5499B07CD22payload size:23 bytes
18:06:55868.14/5SF7BW12571.9
18:06:51868.14/5SF7BW12561.7app eui:70B3D57ED000A30Cdev eui:70B3D5499B07CD22payload size:23 bytes
18:06:40868.14/5SF7BW12571.9
18:06:36868.14/5SF7BW12561.7app eui:70B3D57ED000A30Cdev eui:70B3D5499B07CD22payload size:23 bytes
In detail: The request looked like:
{
  "gw_id": "eui-240ac4fffe000afa",
  "payload": "AAyjANB+1bNwIs0Hm0nVs3ByjS8RHI0=",
  "dev_eui": "70B3D5499B07CD22",
  "lora": {
    "spreading_factor": 7,
    "bandwidth": 125,
    "air_time": 61696000
  },
  "coding_rate": "4/5",
  "timestamp": "2018-02-21T17:07:06.041Z",
  "rssi": -26,
  "snr": 7,
  "app_eui": "70B3D57ED000A30C",
  "frequency": 868100000
}
The join accept looked as:
{
  "gw_id": "eui-240ac4fffe000afa",
  "payload": "IOYMLZ08pUcljjxM2+f7kJe3+1tsKNQV/k5ctIwFNI4u",
  "lora": {
    "spreading_factor": 7,
    "bandwidth": 125,
    "air_time": 71936000
  },
  "coding_rate": "4/5",
  "timestamp": "2018-02-21T17:07:10.042Z",
  "frequency": 868100000
}
If airtime is taken as time ni µs, that matches well the duration of the RF pulse I see.
-
@jmarcelino How long is the receive window? And what starts it? In the test example, it looks simply like socket.recv(n).
In OTAA.join, the protocol is initiated once, and then repeated over & over by the LoRa stack, sending out joind requests and waitung for the response, which arrives within a 5-10 seconds. This response arrives at the gateway and is sent to the node.
I'll send logs this night.
-
@robert-hh
The can happen because the downlink is being sent too late/early from the gateway, so outside the receive window of the node or being sent on a different frequency or spreading factor than the node is expecting.Can you post the logs of the nano-gateway and gateway log as from the TTN backend too? Thanks
-
@jmarcelino It looks like the gateway works, because it forwards a frame to the node. I can see that is sends, I can pick up a RF burst next to the gateway's antenna when it tells it's sending. It's more the node that does not accepts the message.
-
@robert-hh
Yes resetting the board or re-initing the LoRa stack resets the frame counters, you should store the current state with lora.nvram_save() - e.g. after every uplink (send) - and do lora.nvram_restore() after initialisation.I'm not sure why downlinks doesn't pass through the nano-gateway correctly for you in most cases, it's very likely a timing issue, the receive window duration is very short, only enough to detect a preamble.
-
@jmarcelino It stays weird. In ABP mode, I received 1 (in words one) downlink package. In OTAA mode the join confirmation packets get down to the gateway, the gateway sends them, but the node does not accept them, even if I reset all packet counters.
And I verified that the gateway send data by picking up the signal next to the antenna.P.S.: Yes, resetting the xxPy resets the frame counters too. That can be seen at the TTN console.
-
@jmarcelino I glanced though the code. There is data in it called DownlinkCounter and UplinkCounter. These are reset by a function called
ResetMacParameters(), which is called by
LoRaMacInitialization(), which is called by
TASK_LoRa(),
when it receives a E_LORA_CMD_INIT command in mode LORA_WAN.
That makes me believe that these counters are reset when the lora object is created in Python code. But I'm not sure. Do you have an knowledge?B.T.W.: Comments on the counters tells that only 16 bits are used. In the TTN console setup there is an option for 16/32 bit. Maybe it's related.
-
@jmarcelino So, when testing these counters may get out of sync. That may be the reason by both OTAA and ABP worked once.
At the TTN console, I can reset the counter. But what happens then at the node? Is that doomed forever?
-
@robert-hh
They are dropped to prevent replay attacks.With some network servers (TTN for example) you can optionally disable checks on uplink counters. You can't however skip checks for the downlink counters on the LoPy.
It'd be very insecure to ignore downlink counters on the LoPy because packets sent to port 0 contain LoRaMAC commands which can e.g. enable/disable frequencies or affect packet timings.