Pin interrupt latency
-
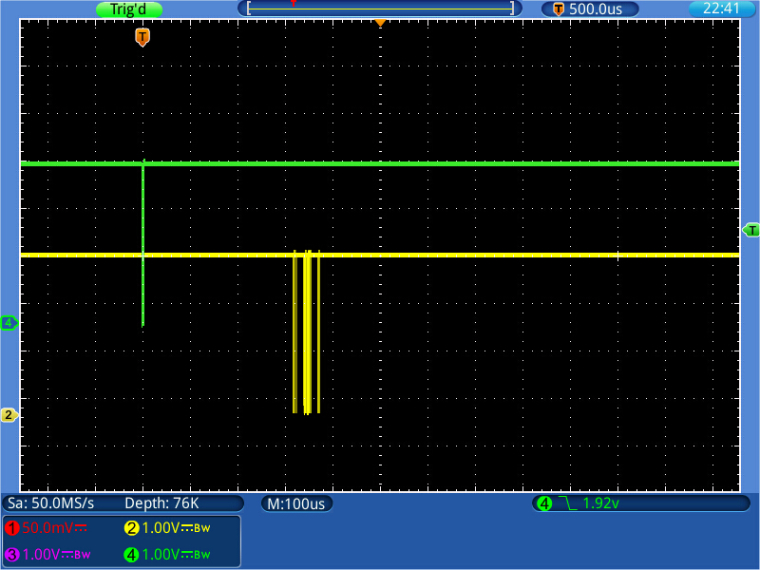
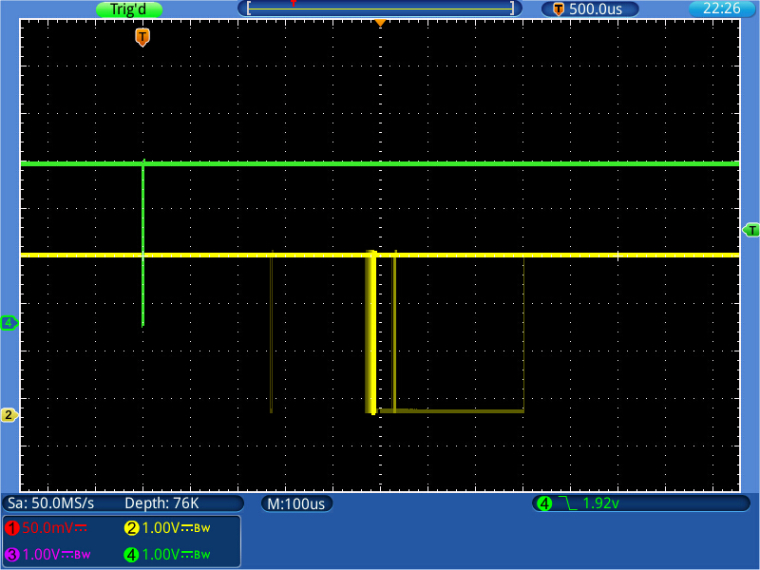
I tested the Pin interrupt latency on a LoPy, just to find very digusting figures. Basically, the response varies by about 100 µs, but the whole time window of response travels in time between 50µ after the pulse up to 900 µs after the pulse in a periodic manner.
That looks like a serious problem. Code for test and two screen shots. The green trace is the source pulse (250 Hz, 4 µs), the yellow trace is the response, with 1 second persistence.
The response pulse width is between 2 and 6 µs:from machine import Pin # resp_pin = Pin("G11", mode=Pin.OUT) resp_pin(1) def resp(p, pout = resp_pin): pout(0) pout(1) irq_pin = Pin("G7", mode=Pin.IN, pull=Pin.PULL_UP) irq_pin.callback(trigger = Pin.IRQ_FALLING, handler = resp, arg=None) try: while True: pass except: pass irq_pin.callback(handler = None)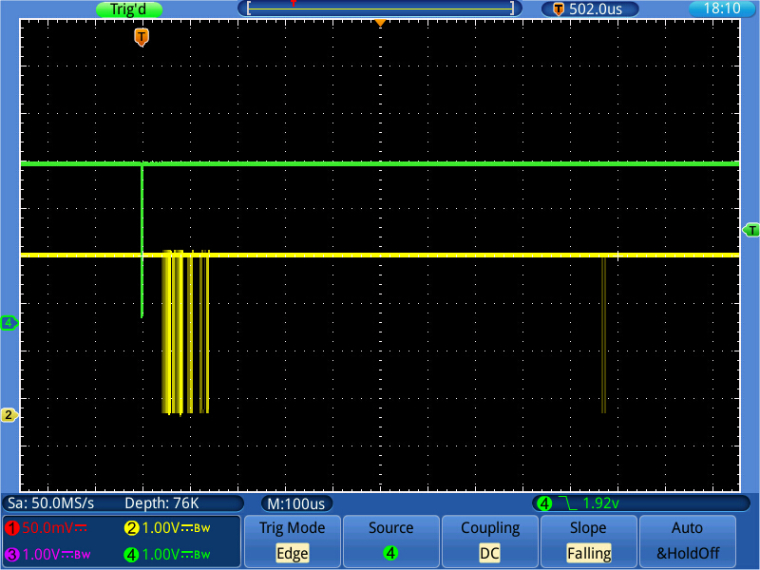
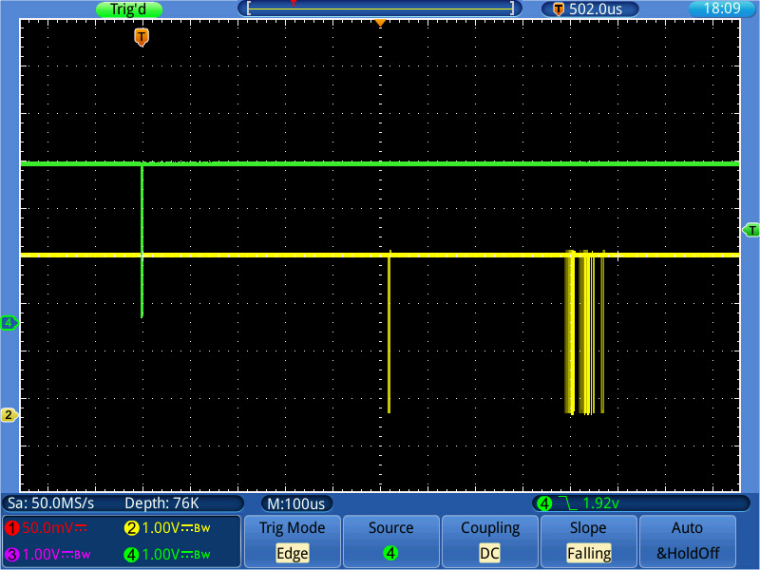
The first picture is close to what I expected, the other phenomenon is not.
Possible reason: The callback is fired by a scheduler, which itself is activated about every ms. And that timer is asynchronous to my generator.
-
@robert-hh
That is strange. I had a look at the pulses coming from the Launchpad and they look fine.
I'll do more testing later.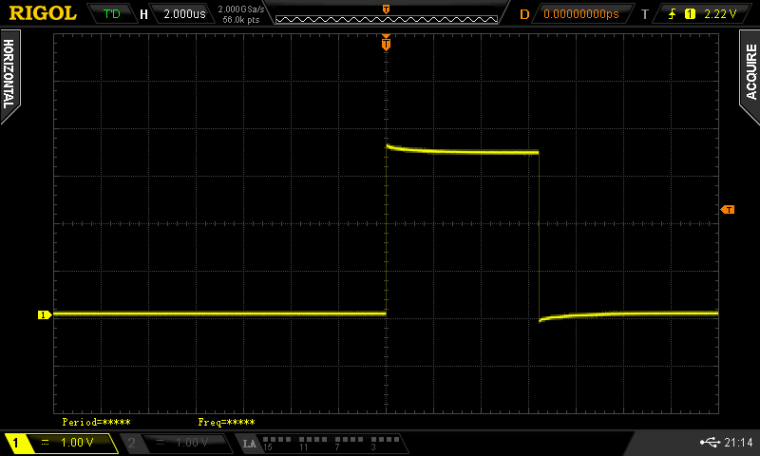
-
@jmarcelino I am running my test now for over an hour trying to trigger on a missing response pulse (= two response pulse further away than 5.2 ms). No luck, meaning no missing pulses. When setting up the test initially, I used the output of an ADC converter for triggering. That caused sometimes strange results. The signal generator I use now has the usual 50 Ohm output impedance, which gave more reproducible results. So maybe your trigger signal's shape not good. The logic analyzer will not tell you. You could try a shorter connection or trigger on the falling edge. Maybe that makes a difference.
-
Just had a re-check and my plot script was missing some pulses, so in fact 10 (out of the 2113) pulses arrived after ~ 275μS and three of those at around 620 μS, the maximum . This was with machine.idle() in the loop.
The pulses I said were missing are definitely not there, I can see them in the plot.
I'll try pulses longer than 6 μS next time.
-
@jmarcelino Good to see your results. The maximum of 275 µs is still not as bad as I have seen with >900 µs. Did you have machine.idle() in the loop?
And it's interesting that you have seen missed pulses. That should not happen, and I cannot tell that from may actual setup.
I think that counting pulses is just one application. Doing any kind of task (e.g. accessing an external sensor after on it's 'ready' signal) is more generic.
With machine.idle(), i do not see the 'rolling burst' effect, but responses between ~40µs to 700 µs, with the majority below 200 µs, and sometimes the response pulse extended to 300 µs (the one at the end). Maybe these are your missing pulses.
A screen shot is attached, with persistence set to infinite, so no pulse is lost. The brightness tells a little bit what happens more often.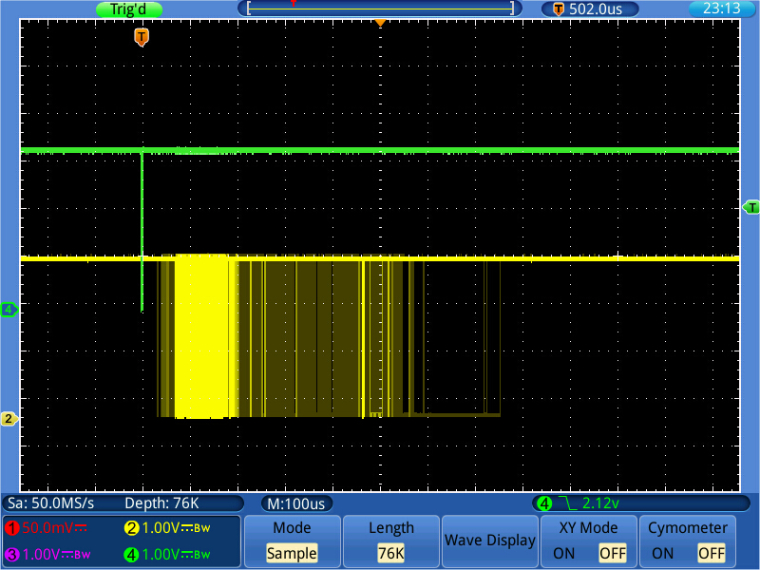
-
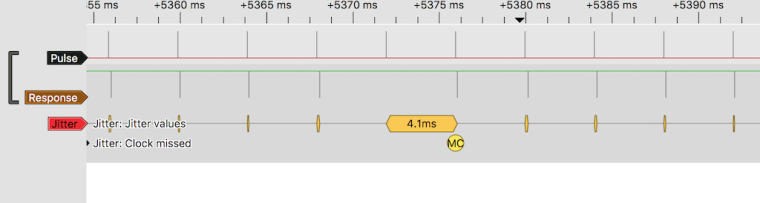
Turns out that Sigrok already has a wonderful latency analysis decoder called Jitter
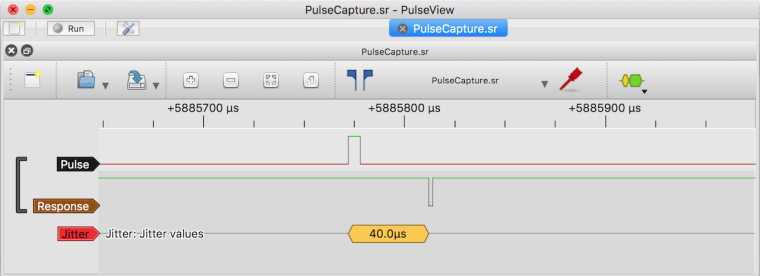
and run on the command line via sigrok-cli it produces a useful list of latencies
jitter-1: 160.0μs
jitter-1: 124.0μs
jitter-1: 90.0μs
jitter-1: 110.0μs
jitter-1: 80.0μs
jitter-1: 158.0μs
...
I also noticed the board seems to have missed 37 pulses of the 2113 sent (250Hz, 6 μS) or 1.7%
Minimum latency was 40 μS while maximum 275 μS, here's a plot. I was trying to do an histogram but still learning matplotlib)

This is a very interesting topic (thanks so much to bringing this up @robert-hh ! ) and look forward to the next experiments and what features like dual core support will bring.
In the ESP32 there's also the Pulse Counter peripheral, which won't improve responsiveness but should catch all pulses reliability with little overhead and maybe more interestingly the RMT peripheral which can be setup as a very efficient pulse receiver straight into RAM (but I need to read more about this)
-
@robert-hh
this is really interesting topic
and thanks for the link to https://github.com/micropython/micropython/issues/2972
-
@jmarcelino Thanks for testing.
It looks as if the problem is the implementation of the handler. Instead of calling the handler almost immediately (= when other higher priority interrupts have finished), the firmware just seems to register the request and call the handler at some time later (within a ms). And yes, everything different than about 10µs is bad for real time reaction. The best cases on ESP8266 are 18µS .. 180µs @ 80 MHz, and on PyBoard it's 8.2 µs stable (discussion here: https://github.com/micropython/micropython/issues/2972).The 300µs delay can also be seen in at the esp8266. Since both esp32 and ESP2866 cannot execute code from flash, that happens when code should be executed which is not cached in RAM. That section has then to be imported from flash to RAM first. This code import takes about 300 µs (SPI data transfer from flash). You can observer that too when you e.g. just 'ping' the device on WiFi. The first response is sometimes very slow, and then the time decreases, like in a 1/100 ratio.
For better response, it might be better if certain codes areas could be made 'sticky'.
-
@livius Yes, it was a core dump. The situation was a little bit different: I had a typo in the sleep() statement in the loop, which stopped script execution with the usual exception. And since the interrupt handler was already started (Python is actually executing statements it reads), the IRQ handler was triggered. That is a common source of surprises when testing code with interrupt handlers and callbacks. Even is your test code is stopped (= your're back at REPL), they are still active and can cause unexpected behavior. That's why in my little test code I deactivate the handler.
-
I've recreated a version of this experiment but using a TI Launchpad as a 6 μS pulse source and a logic analyser using Sigrok and also seeing this variation. For example here the latency is 88 μS but there's 300+ μS elsewhere :
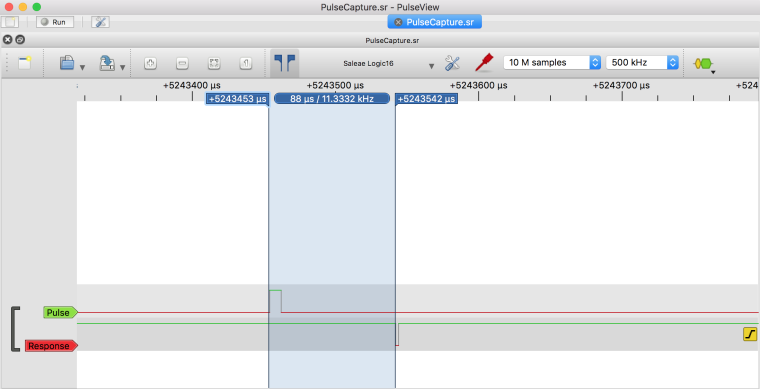
Hopefully I'll be able to script Sigrok - but my first time doing that - to give me actual statistics and then try a few things to see how those numbers change.
For now calling machine.idle() inside the loop seems to reduce the latency.
-
-
@livius If I remove the loop and the last line, I'm back at the REPL prompt, at which point the Lopy crashes. Besides that, in a real program, if it is not the loop, it it something else which consumes CPU cycles. So what are you expecting?
-
@robert-hh
i mean removingtry: while True: pass except: pass irq_pin.callback(handler = None)with the last line also - because without loop last command disable irq at all
-
@jmarcelino Turning wifi and bluetooth off does not change a lot. Only the burst of responses stay more close together in a time window of about 50 µs. But the beats like effect stays, in that this burst moves. I can make it kind of freeze by setting the trigger pulse frequency to 249.995 Hz. That support my guess that actually the callback is called by a kind of timer, which collects IRQ's which happened between timer ticks. Bad for people who need a fast IRQ response.
-
@livius If I remove the while True loop, the code simply stops (obviously). If I use a sleep(1000) instead of pass in the loop, then the behavior is more or less the same, with two differences:
- inside the 100 µs long burst the are two subgroups
- sometimes the response pulse is extended to about 300 µs.
-
If you're already setup could you try this with the WiFi/Bluetooth off as well please?
I suppose this will only improve when MicroPython starts using both cores of the ESP32.
-
@robert-hh
interesting...
what if you remove while true loop
any difference? just curious..